Excel Data Sorting: From Basic to Advanced
Introduction
Data sorting is one of the most commonly used data processing techniques in Excel. It helps you quickly organize and analyze data. From simple single-column sorting to complex multi-column sorting, Excel offers a rich set of sorting features. This article will detail Excel data sorting from basic to advanced techniques, helping you master various sorting methods.
1. Single-Column Sorting (Basic Sorting)
Function
Single-column sorting is the most basic sorting method, used to sort data in a single column in ascending or descending order.
How to Use
Method 1: Using Toolbar Buttons
- Select any cell in the column you want to sort
- In the "Home" tab, under the "Editing" group, click "Sort & Filter"
- Select "Sort A to Z" or "Sort Z to A"
Method 2: Right-Click Menu
- Select any cell in the column you want to sort
- Right-click
- Select "Sort" > "Sort A to Z" or "Sort Z to A"
Method 3: Keyboard Shortcuts
- Ascending:
Ctrl + Shift + A - Descending:
Ctrl + Shift + D
Example
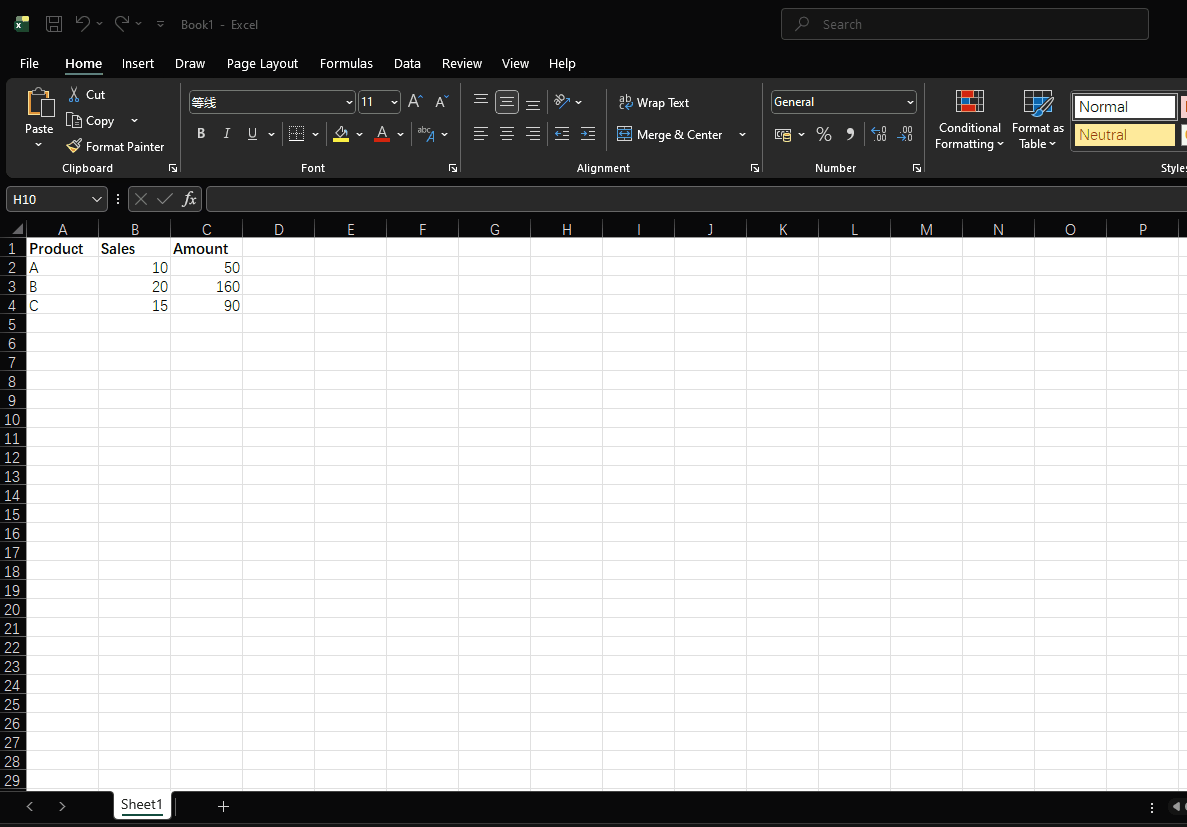
Sort sales data by amount in descending order:
| Product | Sales | Amount |
|---|---|---|
| A | 10 | 50 |
| B | 20 | 160 |
| C | 15 | 90 |
- Select any cell in column C (Amount column)
- Click "Sort & Filter" > "Sort Z to A"
- Data is sorted by amount from highest to lowest
Use Cases
- Sorting by a single metric (such as sales, age, score)
- Quickly finding maximum or minimum values
- Simple data organization
2. Multi-Column Sorting
Function
When you need to sort data based on multiple conditions, you can use multi-column sorting (also known as secondary sorting).
How to Use
- Select any cell in the data range
- Click the "Sort" button on the "Data" tab
- In the "Sort" dialog box:
- Set the primary key and sorting method
- Click "Add Level" to set secondary keys
- You can add multiple conditions
- Click "OK" to execute the sorting
Example
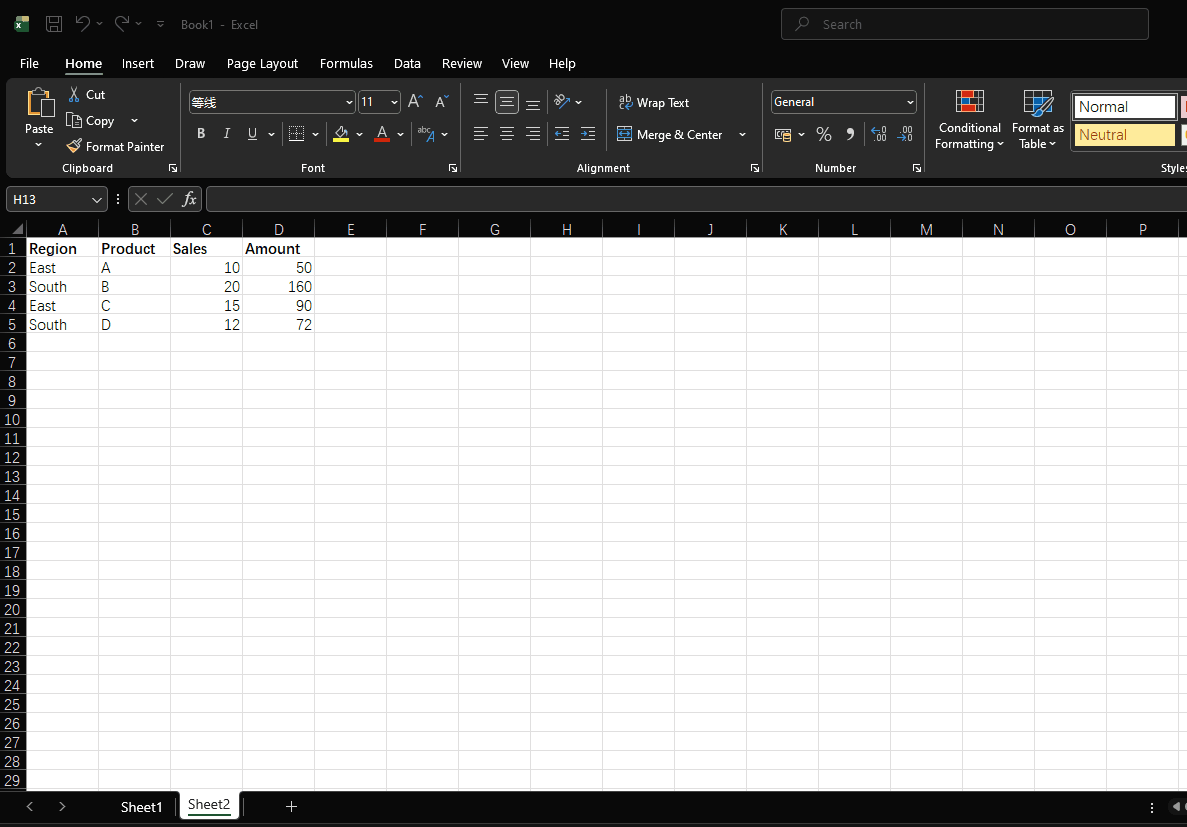
Sort sales data first by region in ascending order, then by amount in descending order:
| Region | Product | Sales | Amount |
|---|---|---|---|
| East | A | 10 | 50 |
| South | B | 20 | 160 |
| East | C | 15 | 90 |
| South | D | 12 | 72 |
- Select any cell in the data range
- Click "Data" > "Sort"
- Set the primary key to "Region" with sorting method "A to Z"
- Click "Add Level", set the secondary key to "Amount" with sorting method "Largest to Smallest"
- Click "OK"
Use Cases
- Sorting by department and sales
- Sorting by class and score
- Sorting by date and time
- Any scenario that requires multiple sorting conditions
3. Custom Sorting
Function
When Excel's default sorting order (alphabetical or numerical) doesn't meet your needs, you can use custom sorting to create your own sorting rules.
How to Use
Method 1: Using Custom Lists
- Click "File" > "Options" > "Advanced"
- Scroll down to "General" and click "Edit Custom Lists"
- In the "List entries" box, type your sequence (one item per line) Example: Q1, Q2, Q3, Q4
- Click "Add" then "OK"
- Select this custom sequence in the sorting dialog box
Method 2: Setting Directly in the Sort Dialog Box
- Open the "Sort" dialog box
- After setting the key, click the "Order" dropdown menu
- Select "Custom List"
- Select or enter a custom sequence
- Click "OK"
Example
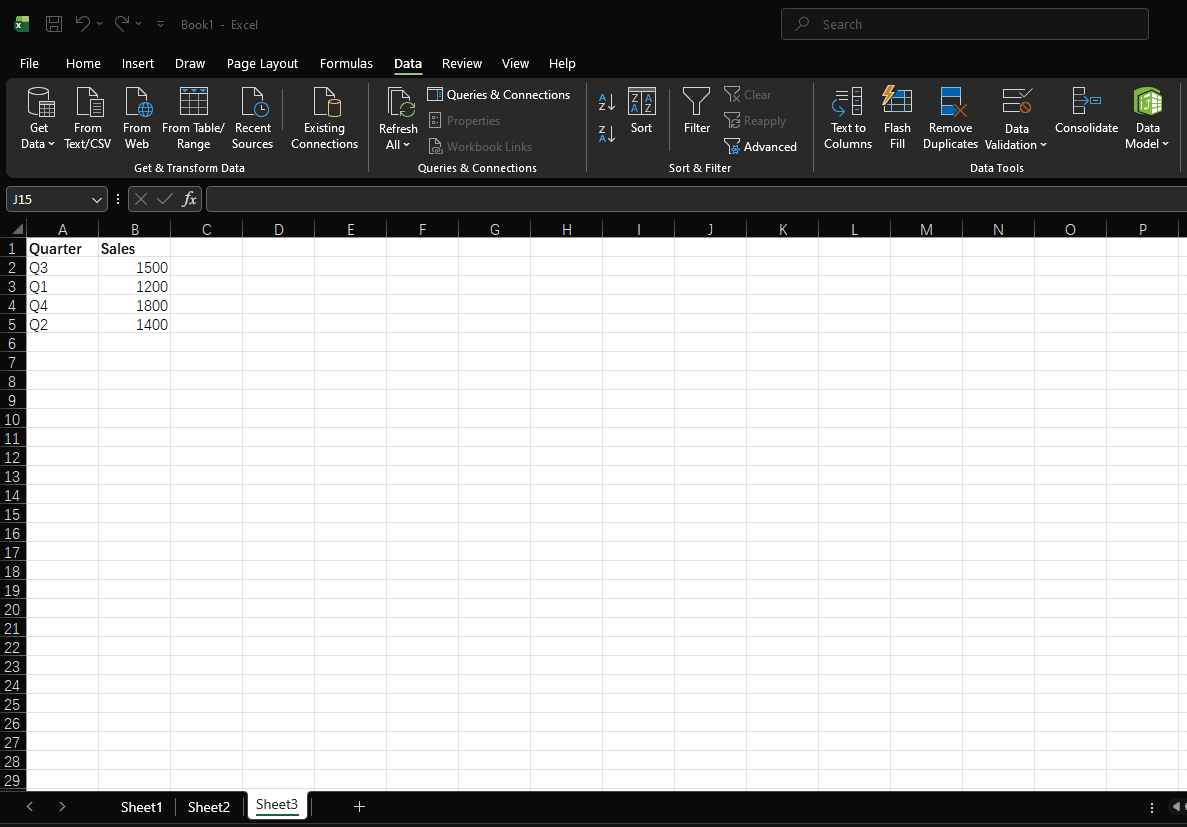
Sort quarterly data with custom sorting:
| Quarter | Sales |
|---|---|
| Q3 | 1500 |
| Q1 | 1200 |
| Q4 | 1800 |
| Q2 | 1400 |
- Open the "Sort" dialog box
- Select "Quarter" as the key
- Select "Custom List" from the Order dropdown
- Select "Q1, Q2, Q3, Q4"
- Click "OK"
Use Cases
- Sorting by quarter, month (e.g., January, February, ..., December)
- Sorting by job level (e.g., Intern, Specialist, Supervisor, Manager)
- Sorting by project phase (e.g., Planning, Execution, Monitoring, Closing)
- Any scenario that requires a specific sorting order
4. Color Sorting
Function
Excel allows sorting by cell color, font color, or conditional formatting color, which is very useful for visual data.
How to Use
- Select any cell in the data range
- Click "Sort & Filter" > "Custom Sort"
- In the "Sort" dialog box:
- Set the key to the column containing color
- Click the "Sort On" dropdown menu
- Select "Cell Color", "Font Color", or "Cell Icon"
- Click the "Order" dropdown menu to select the color to sort by
- Set the sorting order (at the top or bottom)
- Click "OK"
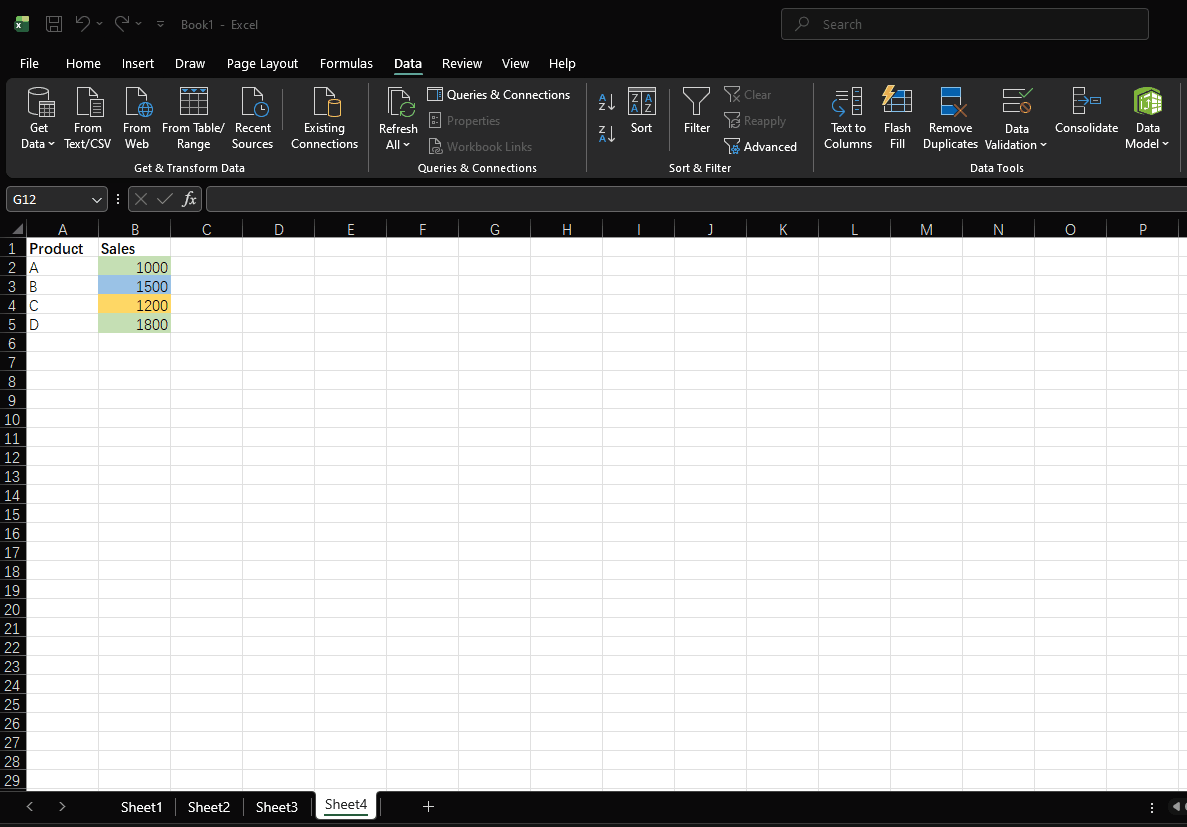
Example
Sort data by cell color:
| Product | Sales |
|---|---|
| A | 1000 |
| B | 1500 |
| C | 1200 |
| D | 1800 |
- Select the data range
- Open the "Sort" dialog box
- Select "Sales" as the key
- Select "Cell Color" as the Sort On option
- Select green from the Order dropdown and set to "On Top"
- Click "Add Level" and add yellow and red in sequence
- Click "OK"
Use Cases
- Sorting conditionally formatted data
- Sorting by priority colors (e.g., Red-Urgent, Yellow-Important, Green-Normal)
- Grouping categorically marked data
5. Advanced Sorting Techniques
5.1 Sorting by Rows
Function
By default, Excel sorts by columns, but sometimes you need to sort by rows (e.g., horizontally arranged data).
How to Use
- Select the row data to be sorted
- Open the "Sort" dialog box
- Click the "Options" button
- In the "Sort Options" dialog box, select "Sort left to right"
- Click "OK" to return to the main dialog box
- Set the sorting key and method
- Click "OK" to execute the sorting
5.2 Keep Header Row During Sorting
Function
Ensure the header row remains at the top and does not participate in sorting.
How to Use
- Open the "Sort" dialog box
- Check the "My data has headers" option
- Click "OK"
5.3 Undo Sorting
Function
If you're not satisfied with the sorting results, you can quickly undo the sorting.
How to Use
- Method 1: Press
Ctrl + Zto undo - Method 2: In the "Sort & Filter" menu, select "Custom Sort" and click "Cancel"
- Method 3: Save a copy before sorting for easy recovery
5.4 Sorting After Filtering
Function
After using the filter function, you can sort the filtered results, sorting only visible data.
How to Use
- Apply filter conditions to display the needed data
- Sort the visible data
- The sorting results only affect visible data
6. Practical Application Example
Example: Student Grade Sorting
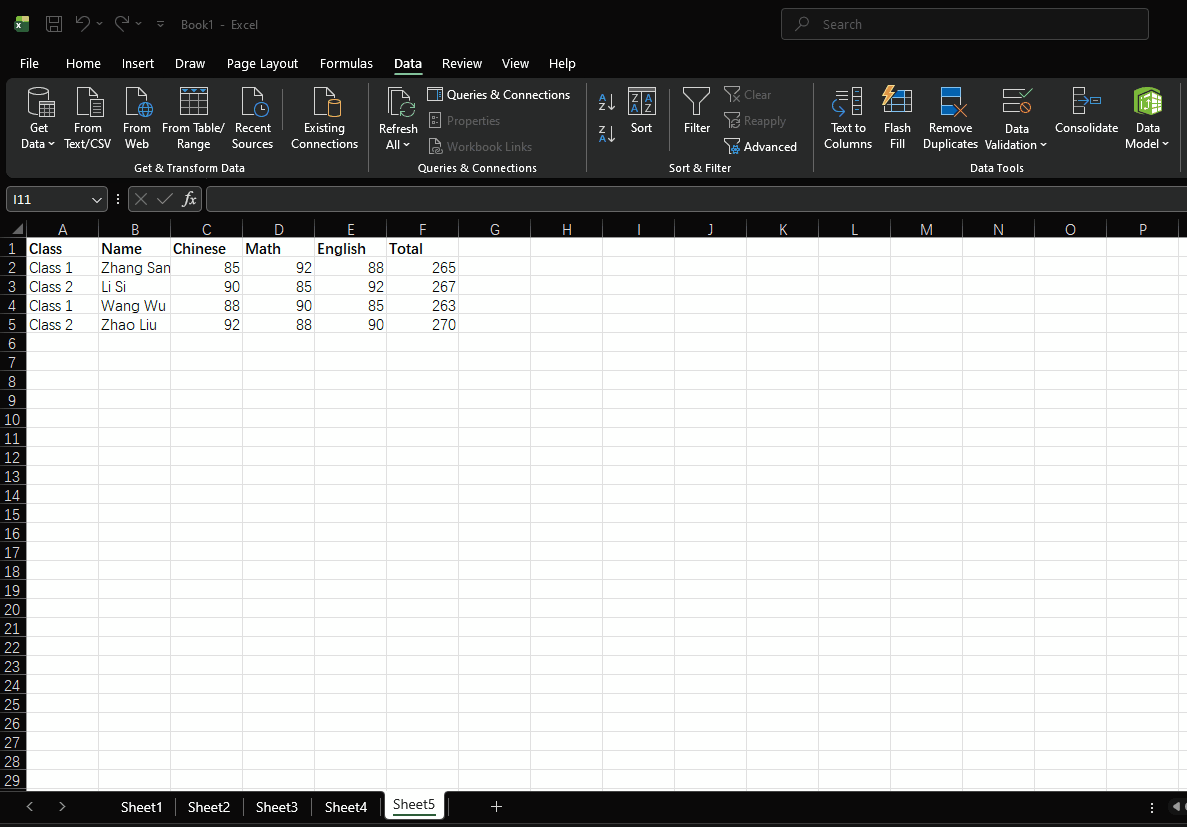
Suppose we have the following student grade data:
| Class | Name | Chinese | Math | English | Total |
|---|---|---|---|---|---|
| Class 1 | Zhang San | 85 | 92 | 88 | 265 |
| Class 2 | Li Si | 90 | 85 | 92 | 267 |
| Class 1 | Wang Wu | 88 | 90 | 85 | 263 |
| Class 2 | Zhao Liu | 92 | 88 | 90 | 270 |
- First sort by class in ascending order
- Then sort by total score in descending order
- Finally sort by math score in descending order
Operation Steps
- Select the data range
- Open the "Sort" dialog box
- Set the primary key to "Class" with sorting method "A to Z"
- Add a secondary key "Total" with sorting method "Largest to Smallest"
- Add a third key "Math" with sorting method "Largest to Smallest"
- Click "OK"
Summary
Excel data sorting is an important data processing technique. Mastering various sorting methods can help you better organize and analyze data:
- Single-Column Sorting: The most basic sorting method, suitable for single-metric sorting
- Multi-Column Sorting: Sorting based on multiple conditions, suitable for complex data
- Custom Sorting: Sorting in a specific order, suitable for non-standard sorting needs
- Color Sorting: Sorting by cell color, font color, or icon, suitable for visual data
- Advanced Sorting Techniques: Including row sorting, keeping header rows, undoing sorting, and sorting after filtering
By reasonably using these sorting techniques, you can greatly improve the efficiency and accuracy of data processing. In practical applications, choosing the appropriate sorting method based on specific needs is key.
Have a problem with Excel or Google Sheets?
Tell us about the issue you're facing, and we'll create a step-by-step guide for it.